New Zealand Convergent Margin
Item
-
Title
-
New Zealand Convergent Margin
-
Description
-
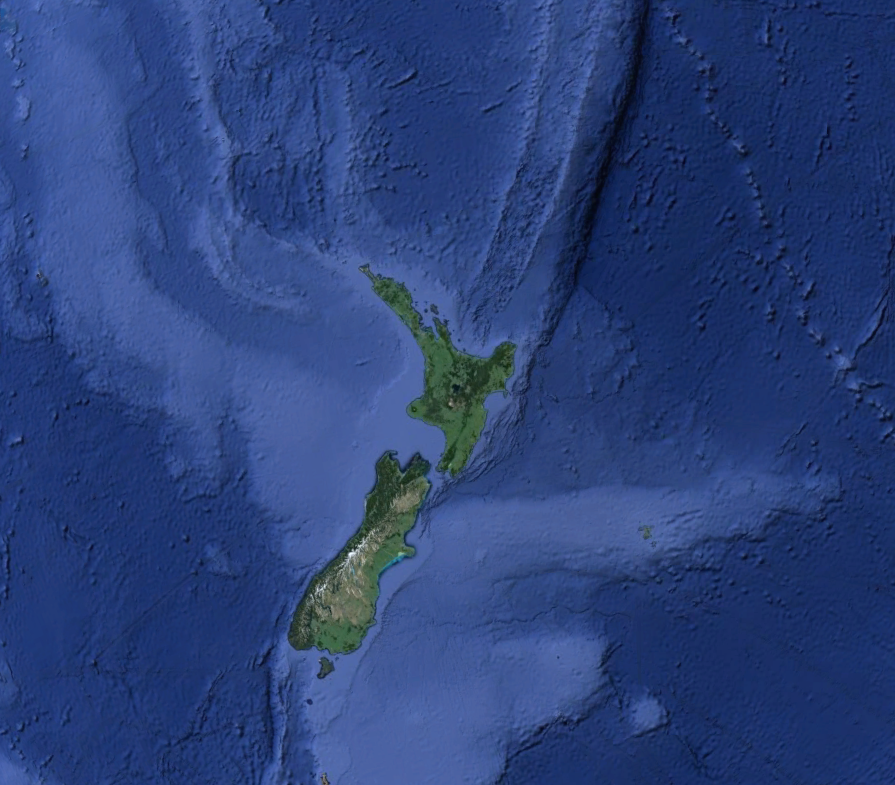
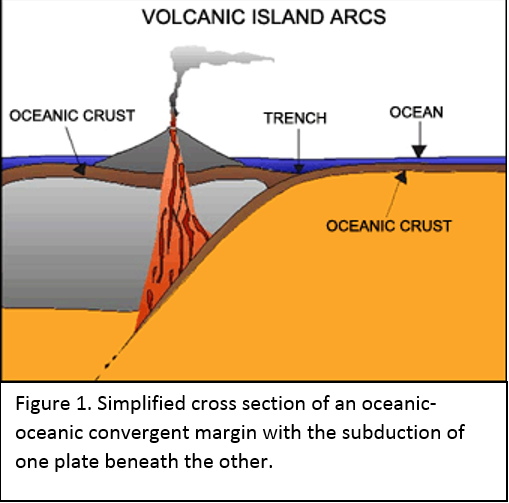
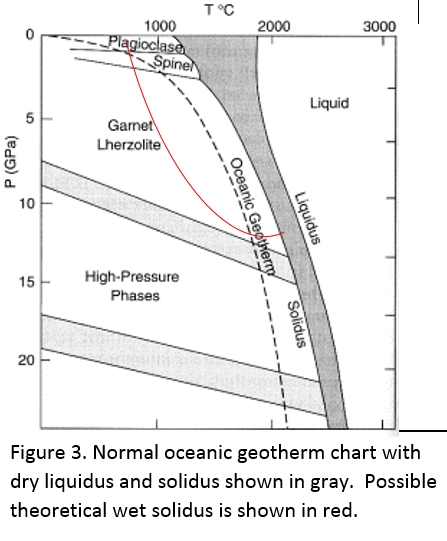
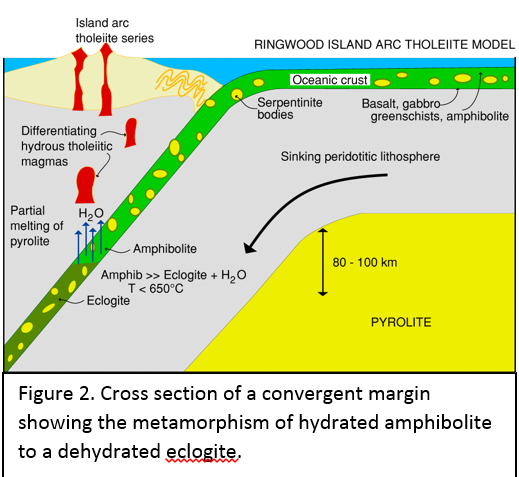
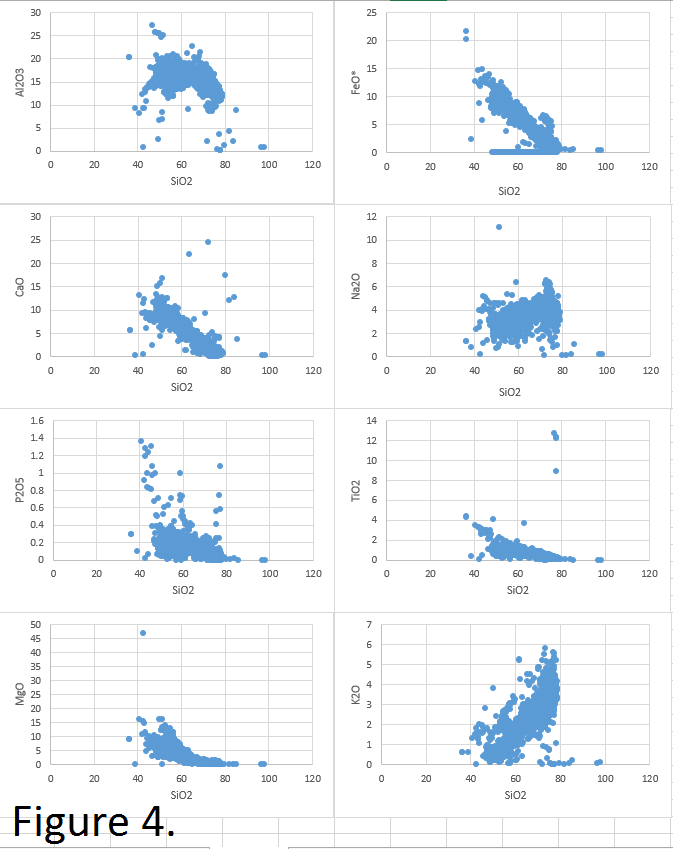
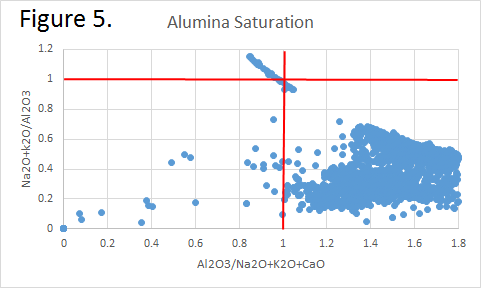
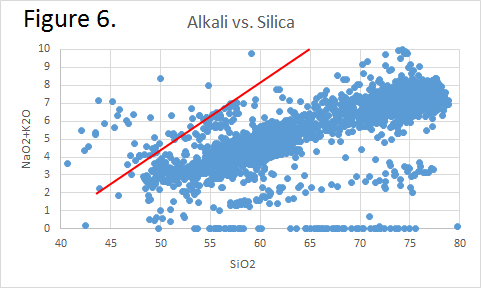
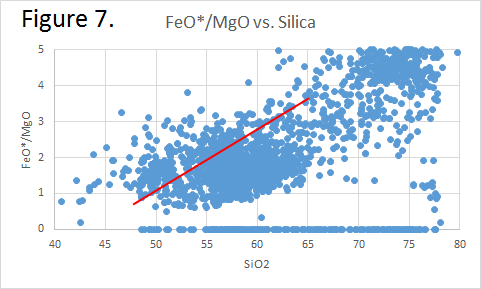
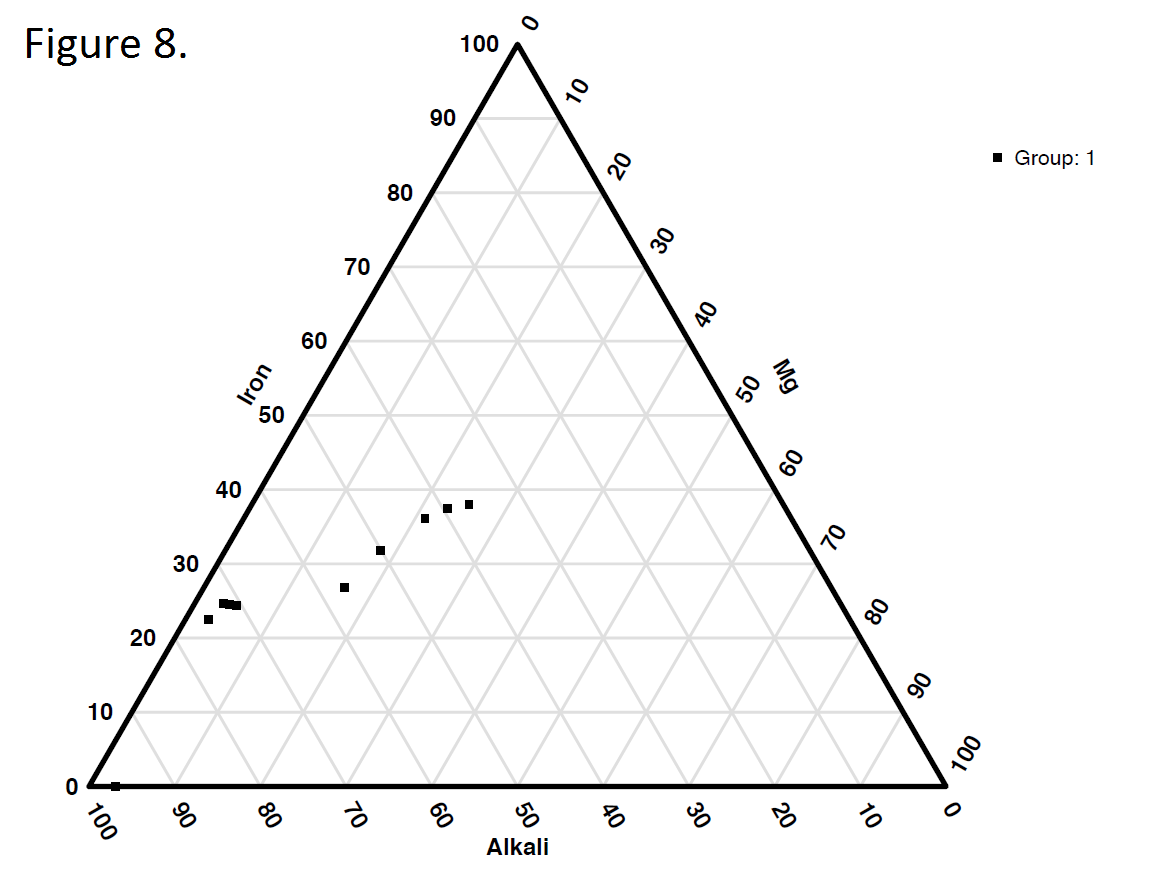
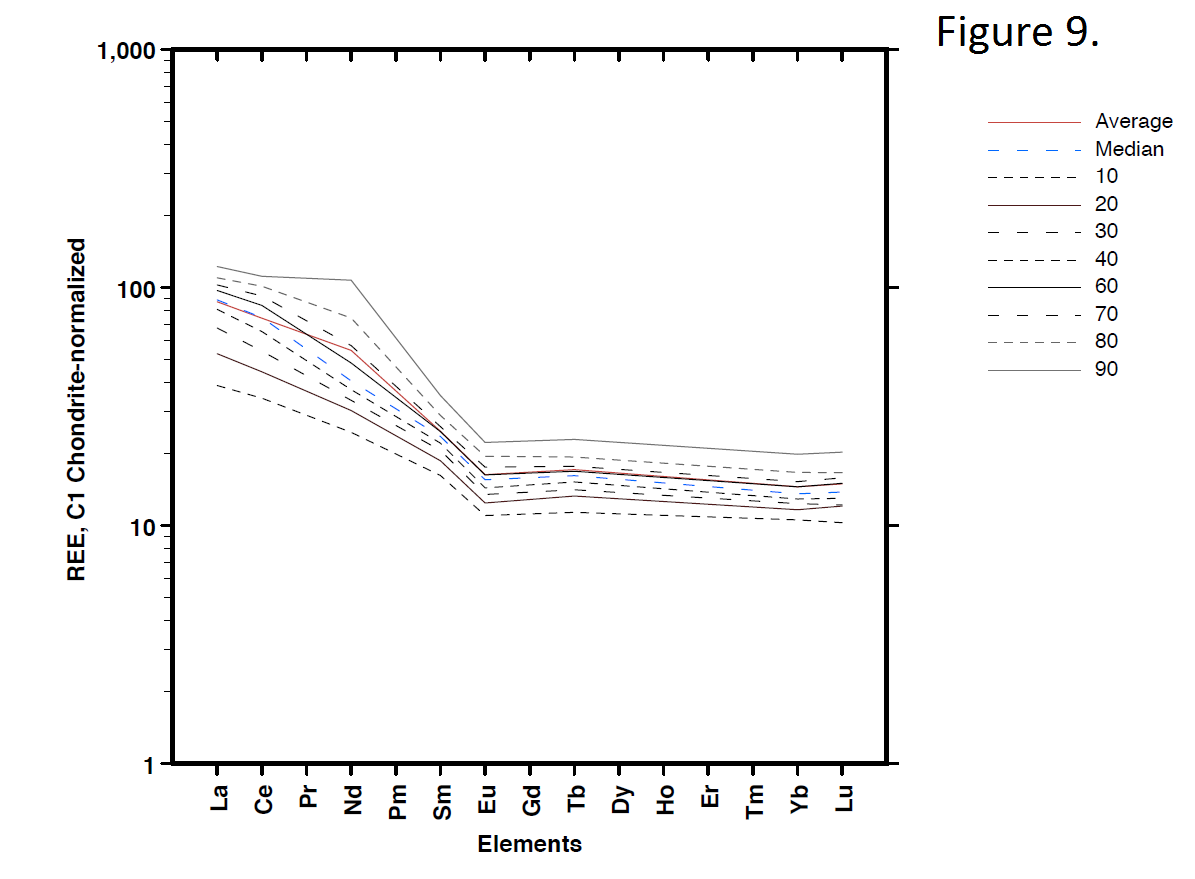
Tectonic Magmatic Setting: New Zealand is formed from the convergence of two oceanic plates, the Pacific, and the Indo-Australian Plate. The Pacific Plate is subducting underneath the Indo-Australian Plate at an approximate rate of 8cm/annum. Physiography/ Landforms: The convergent margin of two oceanic plates causes the formation of an ocean island arc on the overriding plate and a trench in the foreland of the arc. New Zealand is comprised of two islands, the North and South Islands. These islands are formed from multiple composite volcanoes which have all breached sea level and connected together. Just to the east of New Zealand is the Tonga Trench, a depression where the Pacific Plate is being pulled down in subduction. (Figure 1.)Magma Generation: The main driver for melt generation at subduction margins is the introduction of volatiles to the mantle source. At approximately 150 km in depth, the volatiles trapped in amphiboles and sediments carried by the subducting slab are extracted from the metamorphosis of the minerals in the slab. (Figure 2.) The volatiles will enter the mantle material, and change the solidus to be a wet solidus rather than a dry solidus. The wet solidus will shift to intersect the normal oceanic geotherm and allow melting to begin. This melt material will rise through the crustal material and undergo and evolution as time progresses. (Figure 3.)Geochemical Data Analysis and Interpretation: The Harker diagrams show that MgO concentration drops quickly with higher silica melts, along with FeO, CaO, TiO2, and P2O5. Al2O3 concentrations increase with low silica concentrations, but decrease at higher silica concentrations, along with NaO2, which starts decreasing at much higher silica concentrations. K2O is continually rising through all silica levels. There are many compatible elements for this system. The most compatible being MgO. FeO, CaO are readily found and compatible, while TiO2 and P2O5 have low concentrations, but are compatible in the system. Al2O3 is incompatible early in the system, but as the melt evolves to higher silica, feldspars can become more readily formed, making Al2O3 a compatible element in the system. Na2O mimics the Al2O3, only much later in the evolution when Alkali feldspars are able to stabilize. K2O is the only element which is not compatible at any point during the system. (Figure 4.)The Alumina Saturation diagram shows that the majority of the samples are peraluminous. This heavy concentration of aluminum implies that there is an aluminus source which has been depleted in the Alkali content due to the evolution of the melt over time. (Figure 5.)The Alkali vs. Silica diagram shows a strong trend Sub-Alkaline melts. This means that the source of the rock is a depleted source in incompatible elements, and has evolved over time. (Figure 6.)The FeO*/MgO vs. Silica graph shows a predominately calc-alkaline composition, but many samples are on the Tholeiitic side of the border. Calc-alkaline melts are the tendency for a more evolved melt setting characteristic of ocean arc settings, such as New Zealand, but the tendency towards Tholeiitic source implies that the melt is undergoing much less alteration as it progresses through the oceanic crust than other arc settings. (Figure 7.)The AFM Ternary diagram shows a heavily evolved calc-alkaline melt rich in Alkali components compared to the MgO and FeO components. This implies that the melt has undergone evolution and will produce a very diverse melt. (Figure 8.) The REE Chondrite-normalized Spider Diagram shows a heavy concentration in the less compatible REE. This implies that there is a low melt fraction from the source of the melt. The incompatible elements will leave the solid state first, causing a saturation of the elements in the melt which will rise and reach the surface. (Figure 9.)
-
Contributor
-
William DeBarba
-
Mediator
-
Tamara Carley (carleyt@lafayette.edu)
 https://exhibits.lafayette.edu/geology/files/original/e8a740759c671c0293dca5d342ebf699.png
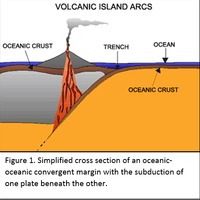 https://exhibits.lafayette.edu/geology/files/original/9977034cd6e60f71b76e53469b07e972.png
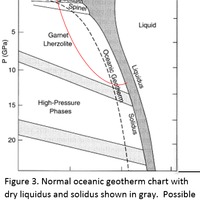 https://exhibits.lafayette.edu/geology/files/original/9f69ca01d764e2e6aeb7d3bc202970e8.png
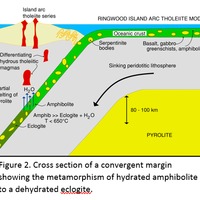 https://exhibits.lafayette.edu/geology/files/original/f72944ceb042fcc81054beb033b076d8.png
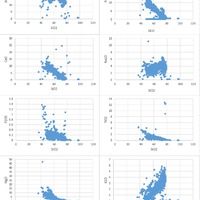 https://exhibits.lafayette.edu/geology/files/original/7102ad0d2b79da4ed703ae8af852b570.png
 https://exhibits.lafayette.edu/geology/files/original/536ff4f1d367128f7b3e40ee6553809a.png
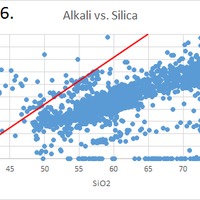 https://exhibits.lafayette.edu/geology/files/original/d720ae4c384ac471366791bbecbf37bb.png
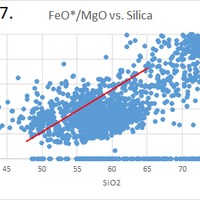 https://exhibits.lafayette.edu/geology/files/original/242d56d6d0dfdcde2f12185b786c5a5c.png
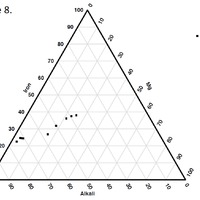 https://exhibits.lafayette.edu/geology/files/original/2868de70efb6e27faaeabc16b57e5e09.png
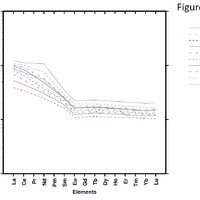 https://exhibits.lafayette.edu/geology/files/original/cb18f67d33d755419f64251c1529589a.png