
Geology 307: Igneous and Metamorphic Petrology (Spring 2015)
Item set
- Title
- Geology 307: Igneous and Metamorphic Petrology (Spring 2015)
- Creator
- Tamara Carley
- Date Created
- 22 January 2015
Items
-
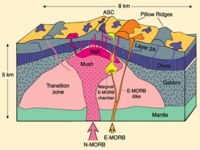 Mid-Ocean Ridges are the major basalt (MORB) producing region of the world. Mid-Ocean Ridges drive plate tectonics. This is because as more basaltic oceanic crust is produced at the Mid-Ocean Ridges, the two plates further divide. Some of the largest and most active Mid-Ocean Ridges are the East Pacific Rise and the Mid Atlantic Ridge. Picture from: Winter, J. D. (n.d.). Igneous and Metamorphic Petrology Class Material. Retrieved May 6, 2015, from https://www.whitman.edu/geology/winter/ JDW_PetClass.htm
 -
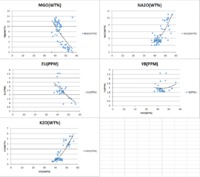
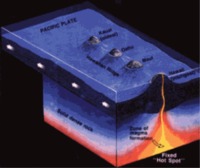
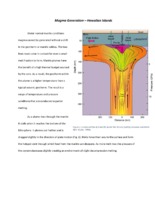
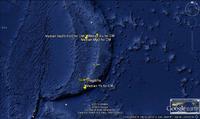
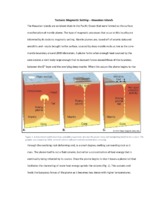
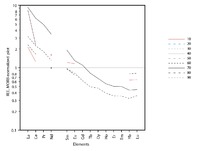
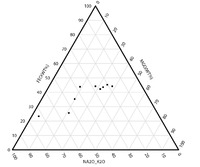
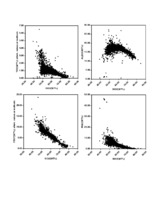
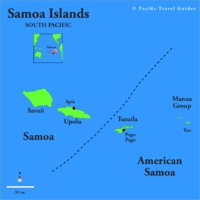 Tectonic Magmatic Setting: The Samoan Islands form as a result of hotspot volcanism. This is intra-oceanic plate volcanism where a rising plume of hot magma will cause oceanic islands to form on the floor of the ocean, eventually rising above sea level. (Figure 1) Physiography/ Landforms: The movement of the oceanic plate under the stationary hotspot causes a chain of islands to form. The chain goes to the northwest where seamounts are found, meaning the plate is moving northwest above the hotspot. The hotspot arc is found just north of the Tonga Trench, which is formed by the convergence of the Pacific and Indo-Australian Plate. There are six main shield volcanoes, each creating their own island, Savai'i, Upolu, Tutulia, Ofu, Olosega, and Ta'u. There is also a submarine volcano to the east, Vailulu'u, which is the current location of the hotspot, and creation of the next island in the Samoan chain. There are some tuff cones on the island of Tutulia, which formed from the aging shield volcano rift on the island. (Figure 2.)Magma Generation: At hotspot islands, the main driver for creating melt is an increase in temperature at a constant depth meaning constant pressure. This is achieved by have a large amount of heated material rise from the core mantle boundary at extreme temperatures. This material will increase the temperature of the mantle at certain locations allowing the geotherm to cross the solidus and create a melt fraction. The core of the hotspot is insulated by the outside material, allowing for higher temperatures and more melt fraction. (Figure 3.) Geochemical Data Analysis and Interpretation: MgO composition decreases the fastest of any element with an increase in SiO2. FeO, P2O5, CaO, and TiO2 also decrease. The alkali elements, Na2O and K2O, along with Al2O3 increase with the increased SiO2 content. These trends imply that MgO is the most compatible element in this system, with the other elements decreasing also being compatible. Al2O3 and the alkalis are incompatible in this system. (Figure 4.) The alumina saturation places the majority of the samples in the metaluminous category, with some samples being peraluminous. Being on the border between metaluminous and peraluminous implies there to have been an evolution in the melt, and since the majority of the samples are metaluminous, a significant amount of evolution has occurred in the system. (Figure 5.) The alkali vs. silica diagram shows a predominately alkaline composition. This implies that the incompatible alkali compositions have not been removed in melt fraction yet. This is a fertile source of melt. (Figure 6.)The AFM Ternary diagram shows an evolution of the melt towards iron rich. This means that the melt is more diverse and evolving and decreasing in Mg#. This melt is straying from becoming a primary melt and acting as a more evolved melt. (Figure 7.)The REE Chondrite-normalized Spider Diagram shows a higher concentration in the incompatible REE. This implies that there is a low melt fraction from the source of the melt. The incompatible elements will leave the solid state first, causing a saturation of the elements in the melt which will rise and reach the surface. (Figure 8.)
 -
 It is apparent given the given diagrams that ocean islands vary chemically from MORBS and convergent margins. Basalts found on ocean islands tend to have the highest levels of incompatible elements. This is because the magma is sourced from deep in the mantle at the boundary of the core.
 -
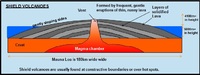
 The Cape Verde Islands were formed through hotspot volcanism. This means that mantle plumes, which originated at the mantle core boundary, rise to the surface, entraining with them undepleted, or fertile mantle. As the oceanic plate moves, the hotspot will stay in the same place. This will create a chain of volcanic landforms. The chain will show the history and movement of the plate. The volcanoes created at a hotspot are shield volcanoes. Shield volcanoes can be extremely large landforms, some containing in excess of 40,000 km3 in volume (Winter, 56). Shield volcanoes are very shallow sloping, usually 3-10 degrees in slope (Winter, 56). The largest of the Cape Verde Islands is called Fogo. This island is a large shield volcano that has been erupting for the last 20 million years (Young). Winter, J. D. (2010). Principals of Igneous and Metamorphic Petrology. New Saddle River, NJ: Pearson Education, Inc. (pp. 5, 385-387, 455). Young, J. Cape Verde’s Eruption: An Example of Hotspot Volcanism. 1 Dec 2014. http://www.decodedscience.com/cape-verdes-eruption-example-hotspot-volcanism/51069
 -
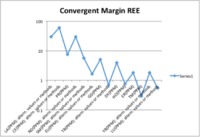 Island arcs like the Andean Arc are usually formed from of calc-alkaline magma. This means that the magma is richer in incompatible elements than typical MORBs. The wealth in incompatibles can be attributed to the fact that the subducting slab releases incompatible elements back into the mantle underneath the arc. These incompatibles are then brought to the surface in the melt. The REE (Rare Earth Element) chart above indicates a decreasing trend line for the incompatible REEs listed in the chart. The trend is decreasing because elements on the left side of the chart are more incompatible than the ones on the right. Therefore, the elements on the right side of the chart will crystallize out of a melt first. This will leave the elements on the left side of the chart in higher concentration once crystallization has progressed. Based on typical Harker Diagrams for a convergent margin, the trend for minerals like Al2O3, Na2O and K2O would correlate positively with SiO2. This happens because these elements are incompatible and crystallize later in melts. Therefore, when the melt begins crystallizing the compatible elements, like TiO2, CaO, FeO, MgO and P2O5 are quickly removed from the melt and put into crystal structures. This increases the concentration of incompatible elements. Likewise, early in melts, compatible elements are dominant because they have not been removed and added to crystal structures. Harker Diagrams made for the Andean Arc were unsuccessful and did not show the proper geochemical trends.
 -
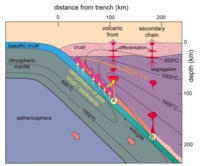
 Volcanic arcs like the Andean Arc are formed through subduction zone volcanism. The collision of the oceanic and continental plates causes folding and faulting which thickens the crust, but also, volcanic processes that create the arc. As the subducting slab sinks deeper into the mantle, it reaches a certain depth where the hydrous minerals in the basalt dehydrate. This water is released into the surrounding mantle and lowers the melting temperature, allowing melting to take place. This melt rises to the top of the mantle and slowly breaks through the crust until it is released the form of lava from a volcano. Melt produced at an island arc like the Andean Arc is calc-alkaline in composition. This means that the melt is high in incompatibles as a result of incompatibles from the subducting slab being reintroduced to the mantle. Picture from: Winter, J. D. (n.d.). Igneous and Metamorphic Petrology Class Material. Retrieved May 6, 2015, from https://www.whitman.edu/geology/winter/ JDW_PetClass.htm
 -
 There are many structures that are commonly associated with subduction zone volcanism. The first is an oceanic trench. The trench is formed where the oceanic crust and the continental crust meet. Because the oceanic crust is being subducted it starts bending downward where it meets the continental crust. This bend creates a low point, or a trench, in the ocean floor. Other common feature at a subduction zone are stratovolcanoes. Stratovolcanoes help to form the island arc itself. Stratovolcanoes are formed by the volcano erupting alternating layers of lava flows and pyroclastic deposits. They are usually tall and have a slope of about 36 degrees. The last common feature of a subduction zone is a back-arc basin. Back-arc basins are formed by extension due to “slab rollback”. Picture from: Winter, J. D. (n.d.). Igneous and Metamorphic Petrology Class Material. Retrieved May 6, 2015, from https://www.whitman.edu/geology/winter/ JDW_PetClass.htm
 -
 The Andean Arc is located on the western side of the South American continent in the Andes Mountains. The Andean Arc was formed by the collision of the Nazca Plate with the western side of the South American plate. A subduction zone was then formed by the Nazca plate subducting beneath the South American continent, which produced the Andean Arc. Picture from: Winter, J. D. (n.d.). Igneous and Metamorphic Petrology Class Material. Retrieved May 6, 2015, from https://www.whitman.edu/geology/winter/ JDW_PetClass.htm
 -
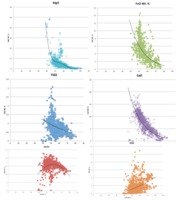
 This image displays four Harker diagrams that compare silica levels to the levels of other minerals in the OIB. In the SiO2 vs TiO2 diagram, TiO2 decreases as silica increases because Ti is very compatible and crystallizes out of the melt very early. Therefore, later in the crystallization process, most of the Ti has been already been removed from the melt in the form of crystallization. Similarly, FeO, CaO, MgO, P2O5 have downward sloping trends because they too are incompatible and crystallize out of the melt before incompatibles. On the other hand as silica increases, Al2O3, K2O and Na2O also increase. This is because they are incompatible and crystallize out of the melt later than the compatible elements. Since compatible elements crystallize out of the melt at early stages of crystallization, the concentration of incompatibles increases as crystallization continues. In the REE diagram, one can easily see a downward sloping trend. This is very typical for ocean island setting because ocean island basalts are rich in incompatible elements. This happens because the lanthanide elements on the left side of the diagram are more incompatible than the elements on the right side of the diagram.
 -
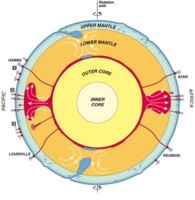 Magma generated at hotspots produces Ocean Island Basalts (OIBs). OIBs have interesting chemical because they are rich in incompatible elements such as rare earth elements and alkalis. This is because OIBs are produced by mantle plumes, which originate at the core-mantle boundary. Most of the mantle at the core-mantle boundary is fertile, meaning that it has never been partially melted. When the mantle is partially melted, the first elements to escape are incompatibles. This means that if the mantle has not been partially melted, it will still be rich in incompatbles. Since the Cape Verde Islands are composed of Ocean Island Basalts, they are rich in incompatibles and alkalis. Picture from: Winter, J. D. (n.d.). Igneous and Metamorphic Petrology Class Material. Retrieved May 6, 2015, from https://www.whitman.edu/geology/winter/ JDW_PetClass.htm
 -
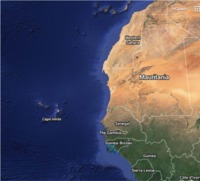 The Cape Verde Islands are located to the east of the African Continental margin. The Cape Verde Islands are in an intraplate tectonic setting. This means that the islands were not produced at a divergent margin (Mid-ocean ridge) setting or a convergent margin (island arc) setting. Instead, they were produced within the margins of a plate by hotspot volcanism. The Cape Verde Islands were produced within the African Plate.
 -
 A description and explanation of the general landforms that compose the Hawaiian Islands as the result of magmatism.
 -
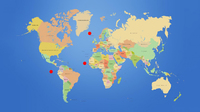 Compare and Contrasting information regarding tectonic setting, landforms, magma generating processes and geochemistry of the Cocos Island, Cape Verde Island and Iceland. The three OI we had were the Cocos Island, Cape Verde and Iceland (marked in red respectively from west to east). The Cocos Islands are located on an intraplate margin in the middle of the Cocos plate in the Pacific Ocean. The Cape Verde Islands are located to the east of the African Continental margin on an intraplate tectonic setting. They were formed due to hotspot volcanism with magma originating from the core mantle boundary. Iceland is located on a divergent boundary between the North American plate and Eurasian plate and also above the Iceland Plume hotspot. Both Cocos Islands and Cape Verde and located on an intraplate setting. The Cocos Islands and Cape Verde both are semi-linear due to the lithosphere moving over the hotspot. Iceland on the other hand is a singular island. The Cocos ridge is ~1000 km long and ~200 km wide and has elevations peaking at 1000 m. The landforms were formed from a submarine volcano. Cape Verde consists of shallow shield volcanos. There are over 150 volcanos on Iceland but only about 30 actives ones which are located on the active rift margins. Magma is generated in ocean island settings through mantle plumes that originate from the core-mantle boundary. In this respect, all ocean islands are similar. However, not all ocean islands are the same. The Cocos Islands and the Cape Verde Islands are similar because they are both in intraplate settings. This means that they are located within the margins of an oceanic plate. Iceland has unusual circomstances because the mid-Atlantic ridge runs through the landmass. In addition to the ridge, a hotspot also influences the spreading center on Iceland. This creates enriched-mid ocean ridge basalts, as opposed to normal ocean island basalts that come from locations like the Cocos Islands and the Cape Verde Islands.
 -
 An explanation of how melts form at the Hawaiian Island magmatic setting.
 -
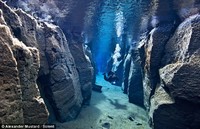 Information regarding tectonic setting, landforms, magma generating processes and geochemistry of Iceland.
 -
 A description of the landforms, magmatic settings, and geochemistry of the Mariana Trench and Volcanic Arc
 -
 A description of the tectonic magmatic setting at which the Hawaiian Islands are situated.
 -
 An investigation and interpretation into the trends discernible in geochemical data for Hawaiian Island basalts.
 -
 A description of the landforms, magmatic settings, and geochemistry of the Canary Islands and Seamount Arc
 -
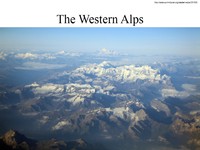 A description of the tectonic setting, landforms, magmatic processes, and geochemistry of the convergent margin of the Western Alps
 -
 The Chondrite-Normalized diagrams
 -
 This ternary diagram shows a representative subset (10-90% wt SiO2) on a AFM ternary diagram. This data suggests that the samples from the Cascade Arc are calc-alkaline, as the samples are relatively depleted in Fe.
 -
 These Harker Diagrams show how major elements behave with increasing SiO2. TiO2, FeO (total), MgO, CaO, and P2O5 decrease with increasing SiO2, as they tend to crystallize early on in the cooling process. K20 and Na2O, however, are incompatible elements, so are not abundant in rocks with low SiO2 (wt%), as they are more stable in the melt until late in the crystallization process. Al2O3 is most compatible around 50% wt. SiO2, resulting in an inverse-U shaped curve.
 -
 Harker Diagram - The Harker Diagram (Figure 1) shows that the studied rocks from this tectonic setting show a low concentration of compatible elements such as Mangesium and Iron and higher concentration of incompatible elements such as Aluminum and Potassium.
 -
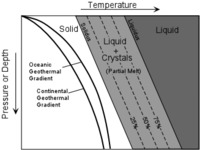 Under normal circumstances, the geothermal gradient (figure 1) does not allow for any amount of melting to occur. At a convergent margin, dewatering of the subducting oceanic slab decreases the melting temperature of the surrounding asthenosphere significantly enough to allow for partial melting of the asthenosphere. This process initiates when the slab approaches a depth of approximately 150 to 200 km.