Geochemical Analysis
Item
- Title
- Geochemical Analysis
- Description
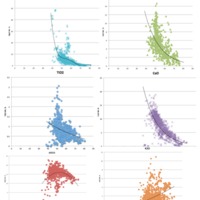
- Harker Diagram - The Harker Diagram (Figure 1) shows that the studied rocks from this tectonic setting show a low concentration of compatible elements such as Mangesium and Iron and higher concentration of incompatible elements such as Aluminum and Potassium.
- Subject
- Bismarck Arc to New Britain Arc
- Creator
- Robert Ashton
- Date
- May 5th, 2015
- Rights Holder
- Lafayette College Department of Geology & Environmental Geosciences
- Media
 Figure 1: Harker Diagram analyzing concentrations of variable chemical components by weight percentage. SiO2 Wt. percent as the cumulative x-axis.
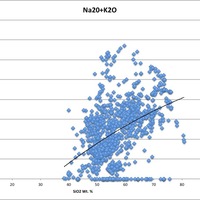
 Figure 3: Na2O + K2) Wt. % for the Bismarck - New Britain Arc Chain
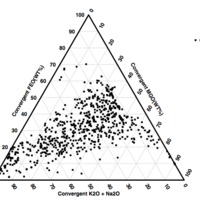
 Figure 4: Ternary Diagram
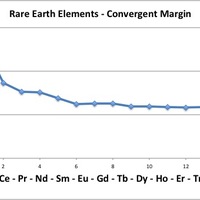
 Figure 2: Rare Earth Elements normalized to Chondrite


