Cape Verde Islands Geochemistry
Item
-
Title
-
Cape Verde Islands Geochemistry
-
Description
-
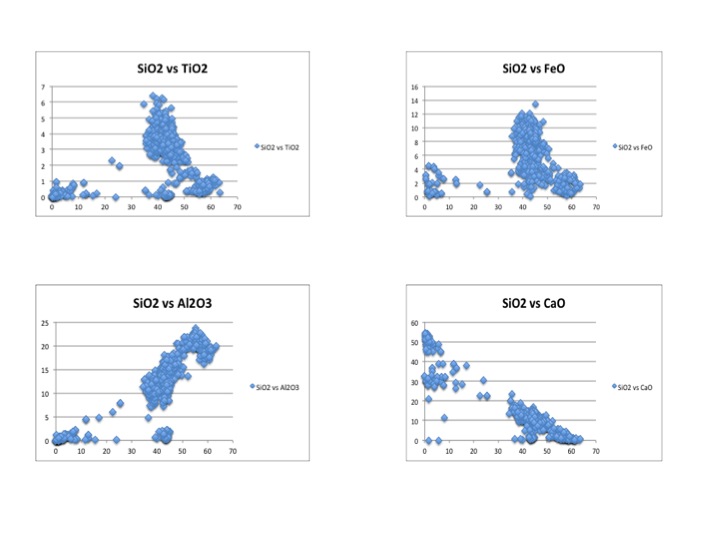
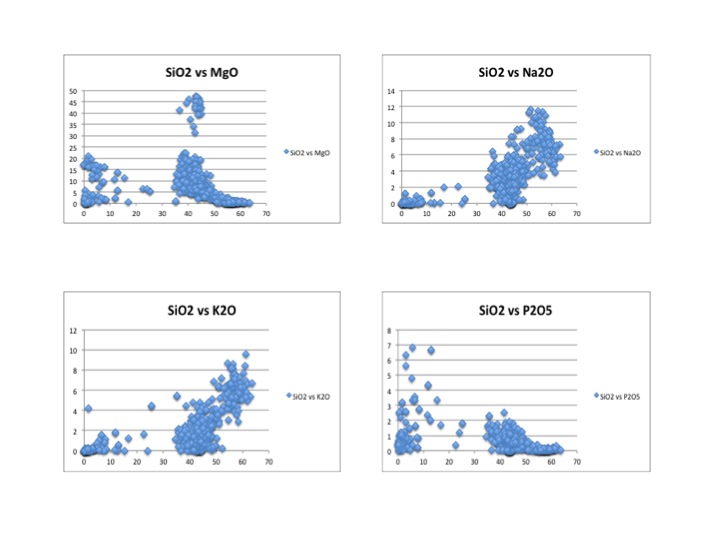
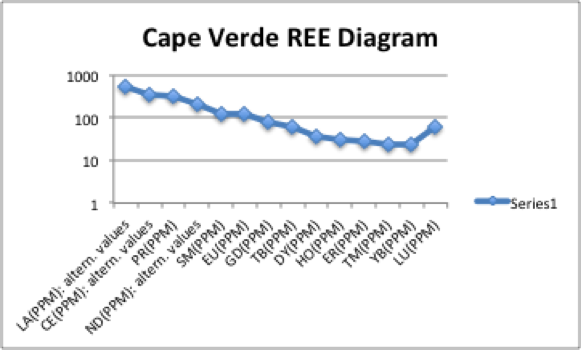
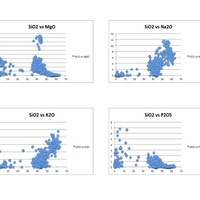
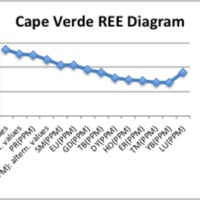
This image displays four Harker diagrams that compare silica levels to the levels of other minerals in the OIB. In the SiO2 vs TiO2 diagram, TiO2 decreases as silica increases because Ti is very compatible and crystallizes out of the melt very early. Therefore, later in the crystallization process, most of the Ti has been already been removed from the melt in the form of crystallization. Similarly, FeO, CaO, MgO, P2O5 have downward sloping trends because they too are incompatible and crystallize out of the melt before incompatibles. On the other hand as silica increases, Al2O3, K2O and Na2O also increase. This is because they are incompatible and crystallize out of the melt later than the compatible elements. Since compatible elements crystallize out of the melt at early stages of crystallization, the concentration of incompatibles increases as crystallization continues. In the REE diagram, one can easily see a downward sloping trend. This is very typical for ocean island setting because ocean island basalts are rich in incompatible elements. This happens because the lanthanide elements on the left side of the diagram are more incompatible than the elements on the right side of the diagram.
-
Creator
-
Claire Kojaian
-
Mediator
-
Tamara Carley
carleyt@lafayette.edu
-
Rights Holder
-
Lafayette College Department of Geology and Environmental Geosciences