Samoan Islands
Item
-
Title
-
Samoan Islands
-
Description
-
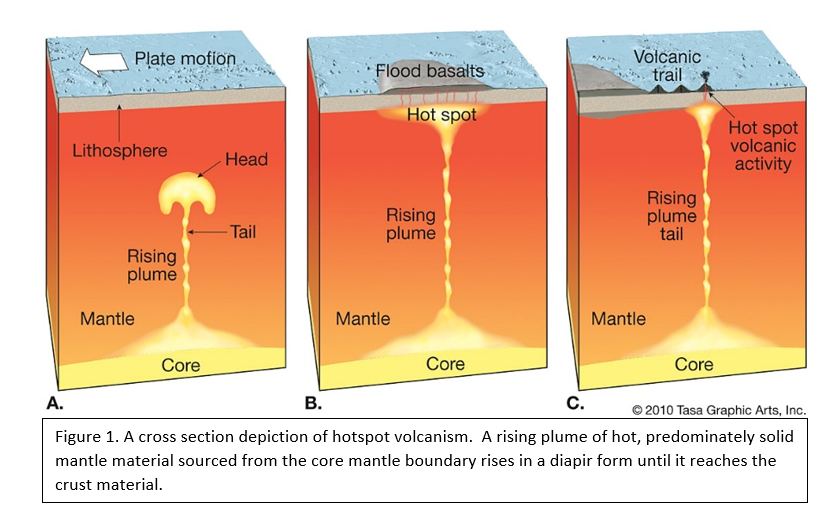
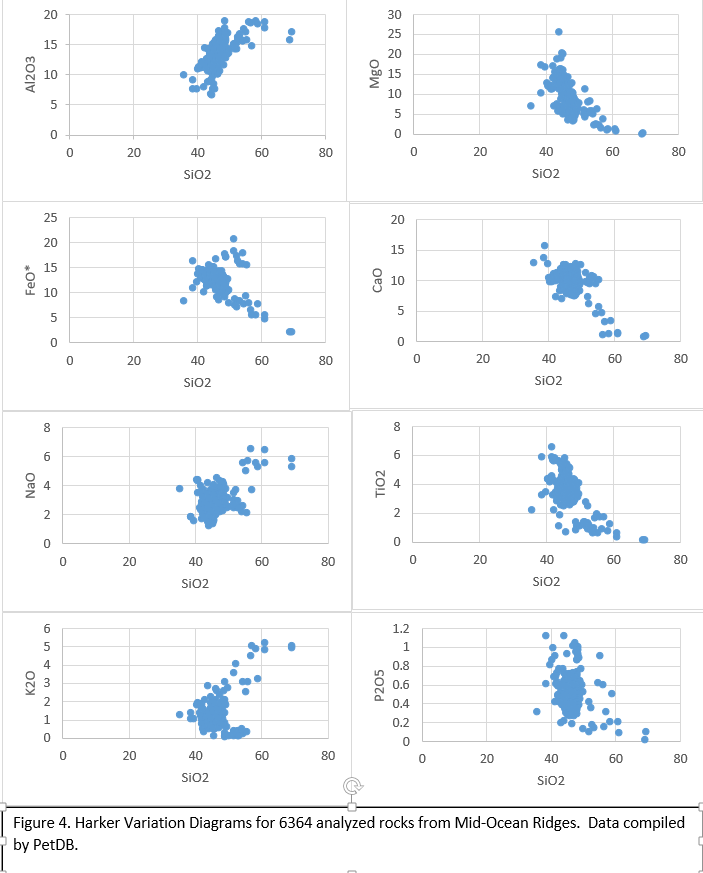
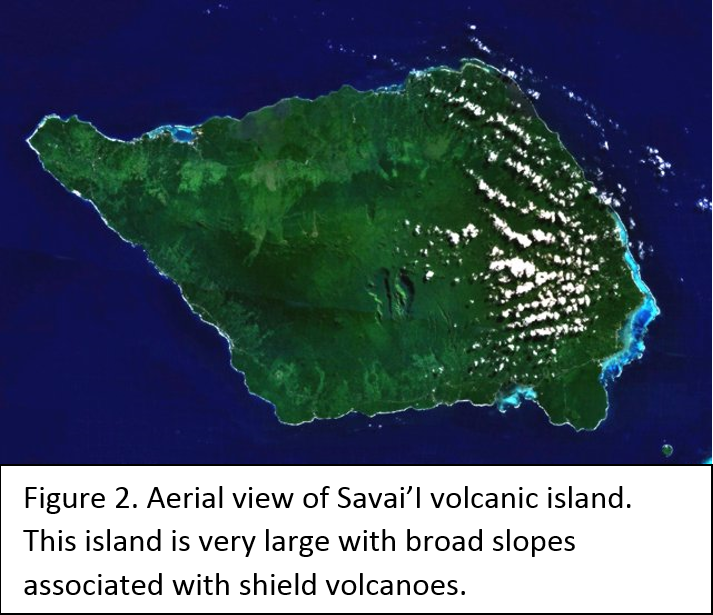
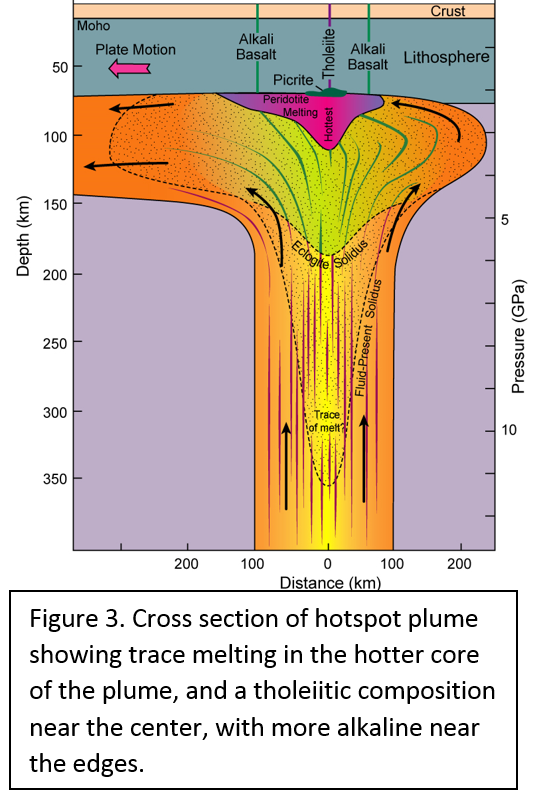
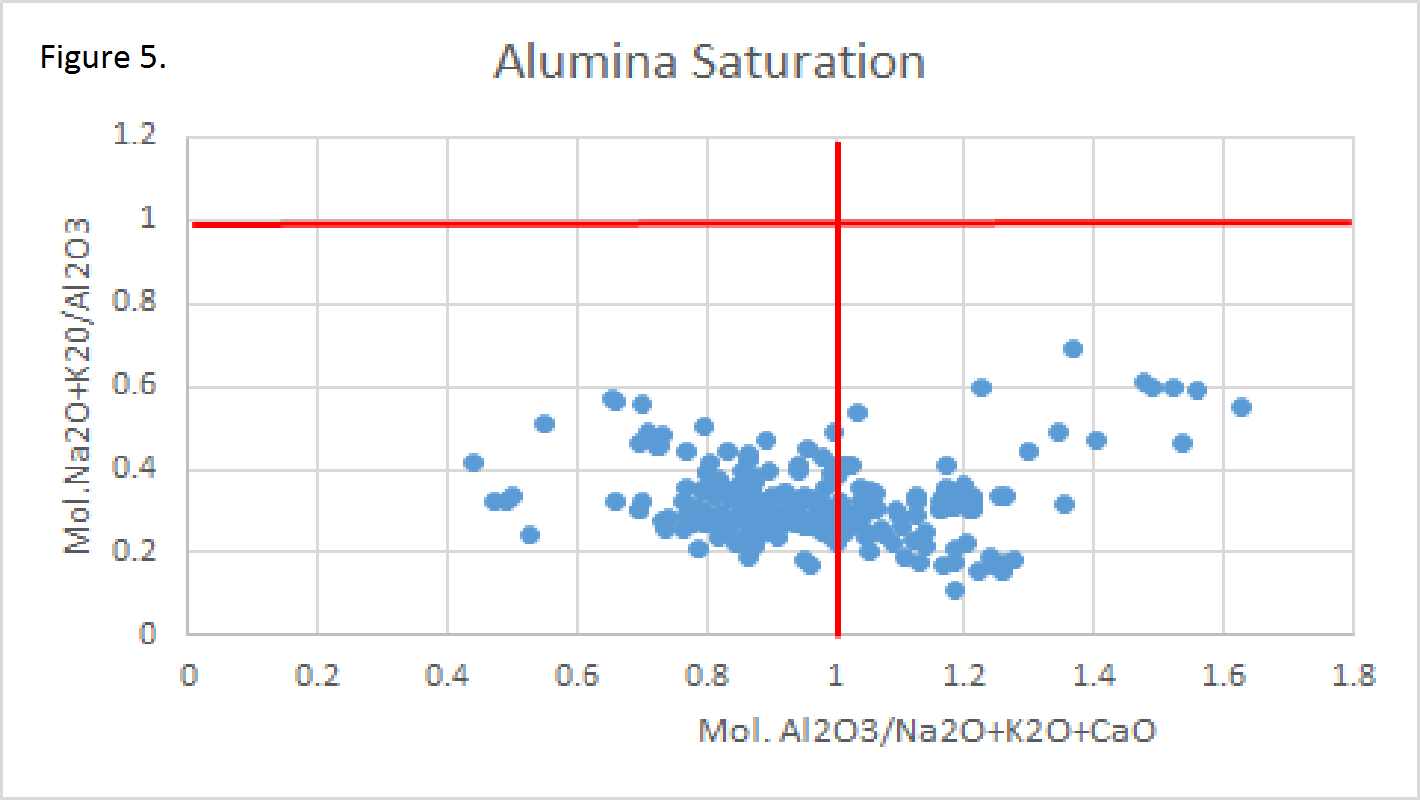
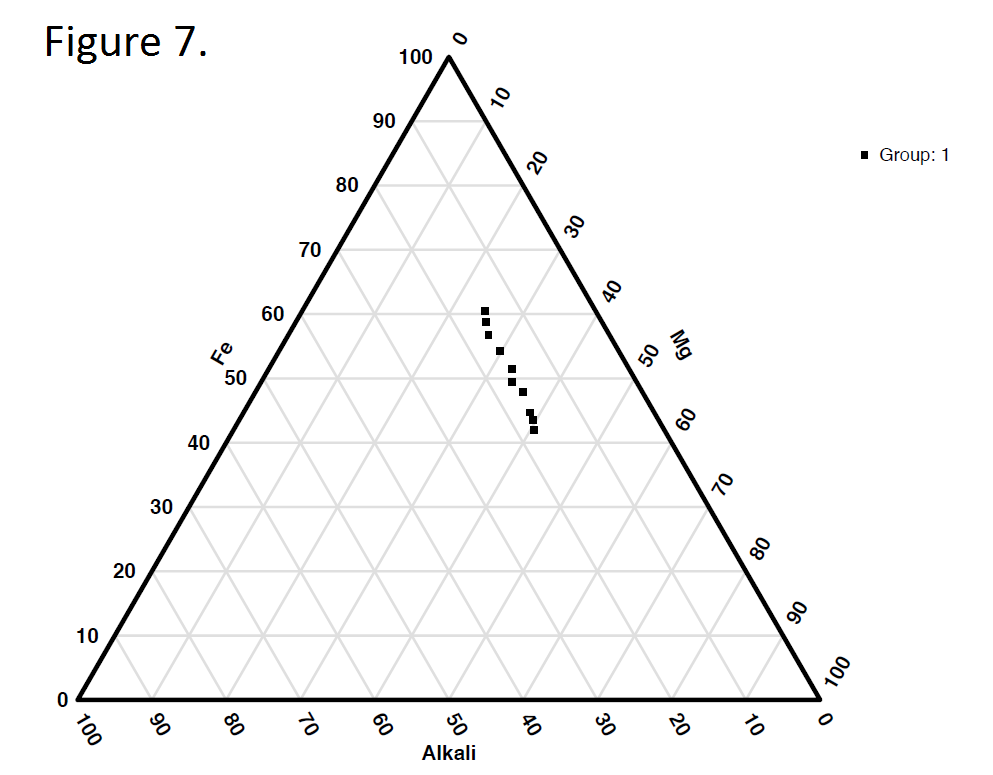
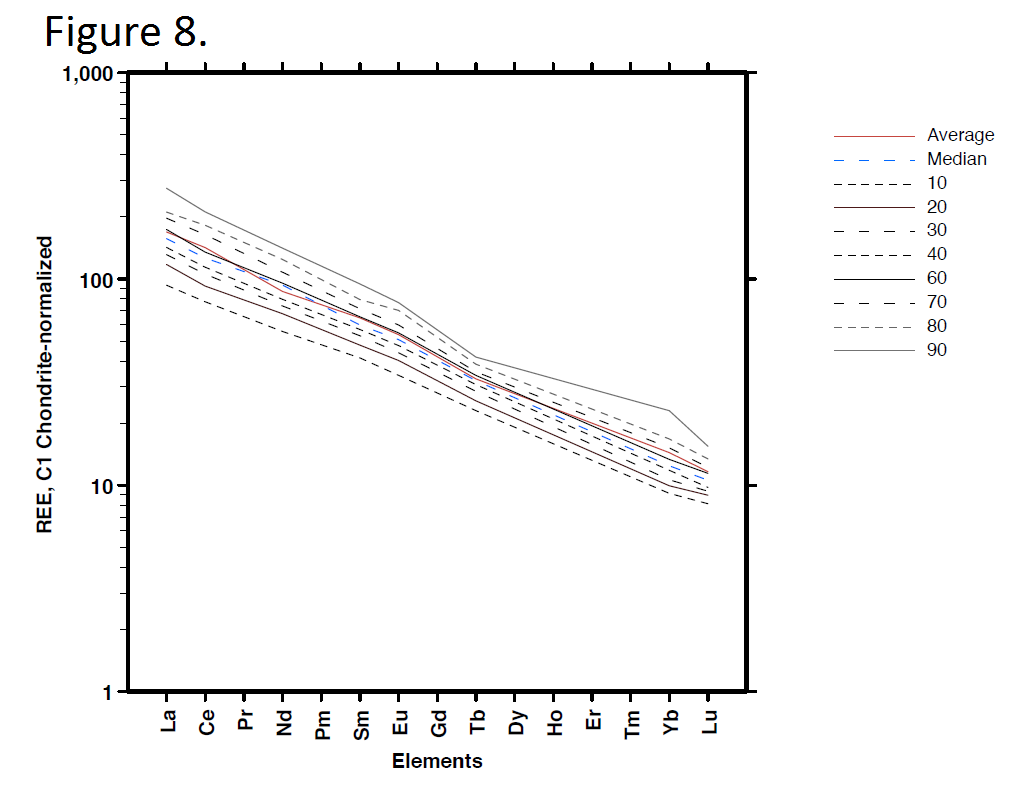
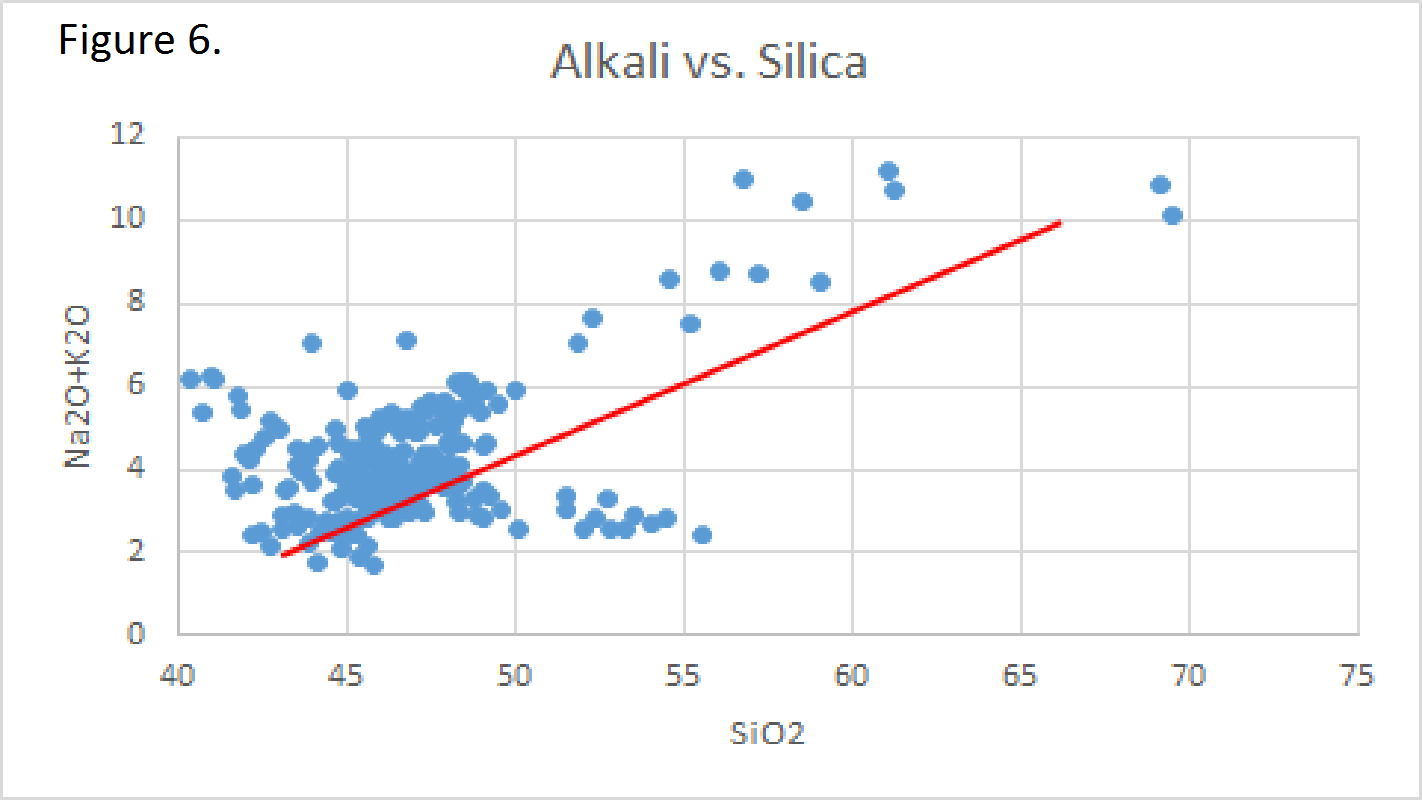
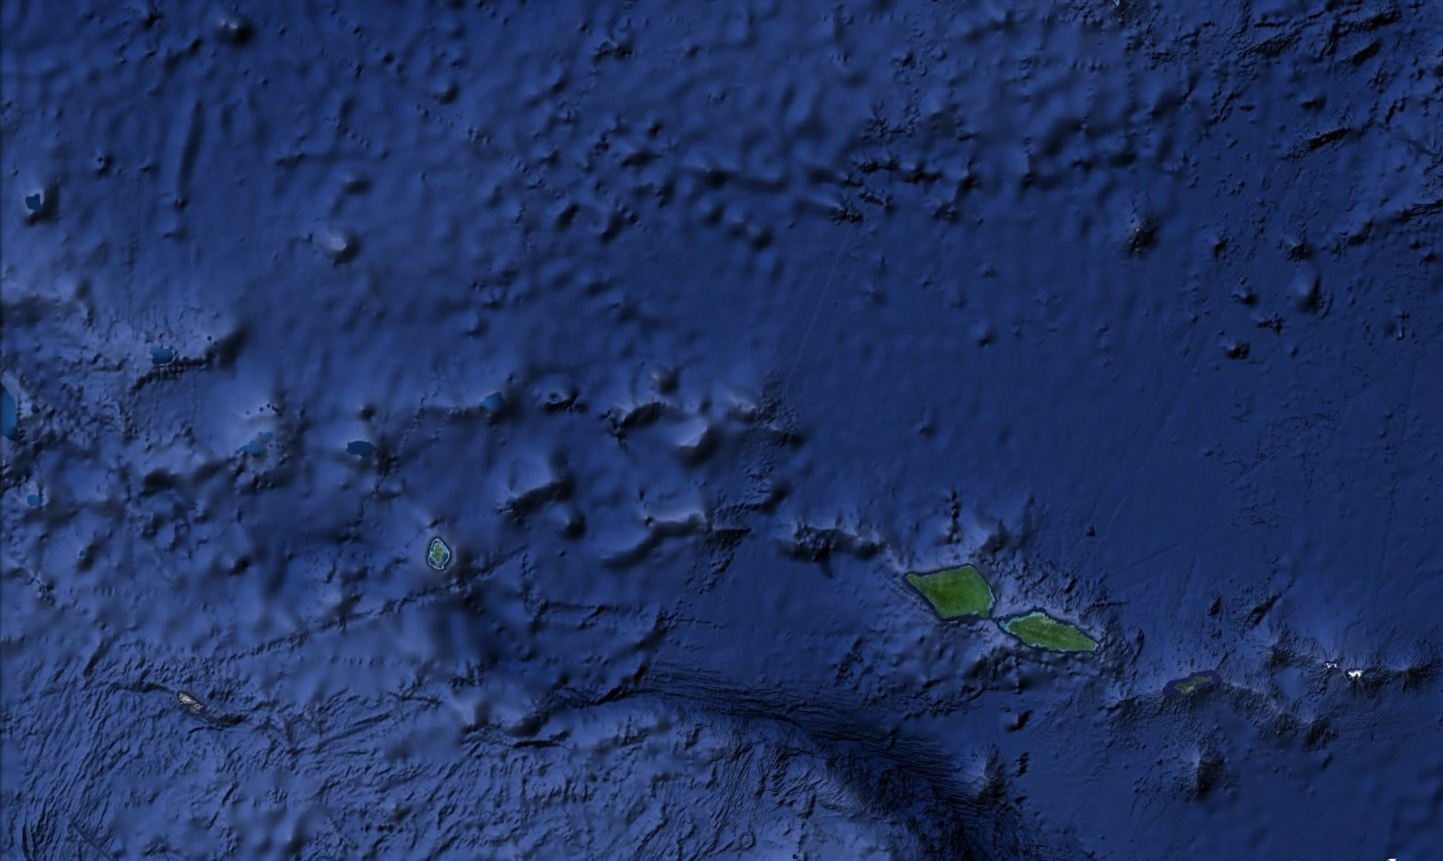
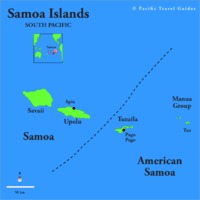
Tectonic Magmatic Setting: The Samoan Islands form as a result of hotspot volcanism. This is intra-oceanic plate volcanism where a rising plume of hot magma will cause oceanic islands to form on the floor of the ocean, eventually rising above sea level. (Figure 1) Physiography/ Landforms: The movement of the oceanic plate under the stationary hotspot causes a chain of islands to form. The chain goes to the northwest where seamounts are found, meaning the plate is moving northwest above the hotspot. The hotspot arc is found just north of the Tonga Trench, which is formed by the convergence of the Pacific and Indo-Australian Plate. There are six main shield volcanoes, each creating their own island, Savai'i, Upolu, Tutulia, Ofu, Olosega, and Ta'u. There is also a submarine volcano to the east, Vailulu'u, which is the current location of the hotspot, and creation of the next island in the Samoan chain. There are some tuff cones on the island of Tutulia, which formed from the aging shield volcano rift on the island. (Figure 2.)Magma Generation: At hotspot islands, the main driver for creating melt is an increase in temperature at a constant depth meaning constant pressure. This is achieved by have a large amount of heated material rise from the core mantle boundary at extreme temperatures. This material will increase the temperature of the mantle at certain locations allowing the geotherm to cross the solidus and create a melt fraction. The core of the hotspot is insulated by the outside material, allowing for higher temperatures and more melt fraction. (Figure 3.) Geochemical Data Analysis and Interpretation: MgO composition decreases the fastest of any element with an increase in SiO2. FeO, P2O5, CaO, and TiO2 also decrease. The alkali elements, Na2O and K2O, along with Al2O3 increase with the increased SiO2 content. These trends imply that MgO is the most compatible element in this system, with the other elements decreasing also being compatible. Al2O3 and the alkalis are incompatible in this system. (Figure 4.) The alumina saturation places the majority of the samples in the metaluminous category, with some samples being peraluminous. Being on the border between metaluminous and peraluminous implies there to have been an evolution in the melt, and since the majority of the samples are metaluminous, a significant amount of evolution has occurred in the system. (Figure 5.) The alkali vs. silica diagram shows a predominately alkaline composition. This implies that the incompatible alkali compositions have not been removed in melt fraction yet. This is a fertile source of melt. (Figure 6.)The AFM Ternary diagram shows an evolution of the melt towards iron rich. This means that the melt is more diverse and evolving and decreasing in Mg#. This melt is straying from becoming a primary melt and acting as a more evolved melt. (Figure 7.)The REE Chondrite-normalized Spider Diagram shows a higher concentration in the incompatible REE. This implies that there is a low melt fraction from the source of the melt. The incompatible elements will leave the solid state first, causing a saturation of the elements in the melt which will rise and reach the surface. (Figure 8.)
-
Contributor
-
William DeBarba
-
Mediator
-
Tamara Carley (carleyt@lafayette.edu)

 https://exhibits.lafayette.edu/geology/files/original/86fcd68868d26f1f70f2bccb4ea90717.gif
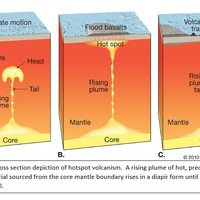 https://exhibits.lafayette.edu/geology/files/original/064ce3374616af23c4e8841f92bd7320.png
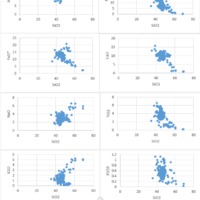 https://exhibits.lafayette.edu/geology/files/original/42392587056f8373fe5d08a67e36eb2a.png
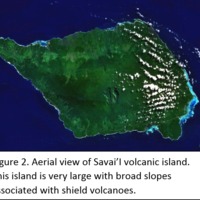 https://exhibits.lafayette.edu/geology/files/original/01e7017e041a32112cebf986783f5dfa.png
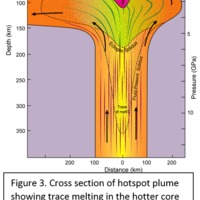 https://exhibits.lafayette.edu/geology/files/original/91d1d9f67d8eb3067926b7c2e4b7e21e.png
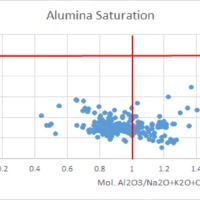 https://exhibits.lafayette.edu/geology/files/original/eb5d969a68855db26c5c31663d1751e9.png
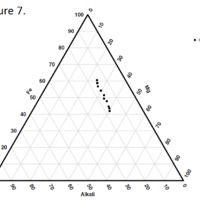 https://exhibits.lafayette.edu/geology/files/original/d22ae2a925eadcacb7f050e1a40f07e3.png
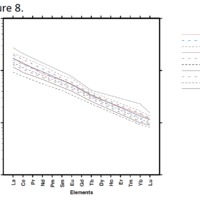 https://exhibits.lafayette.edu/geology/files/original/5960e59e25a61d5f7bcd6a7a9555a298.png
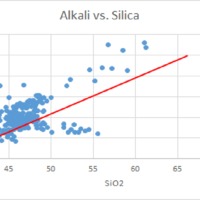 https://exhibits.lafayette.edu/geology/files/original/90e2f3eb82c17181d472b19380e3b63d.png
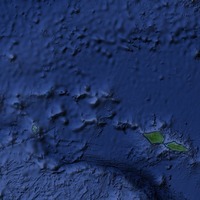 https://exhibits.lafayette.edu/geology/files/original/13b7bfa7fe149330306db762768176ae.png