https://exhibits.lafayette.edu/omeka/files/original/8485204ff4fdbd26be91ceb5a14bcd15.png
Media
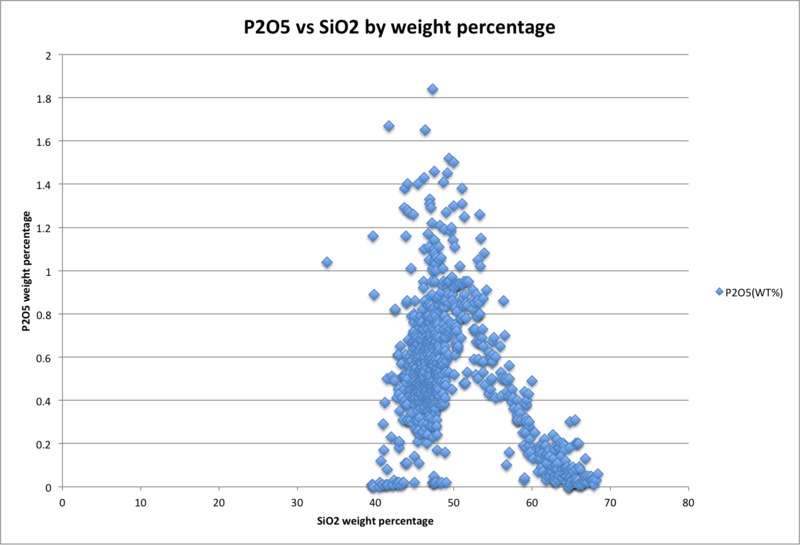
Part of Ocean Island Basalt Setting: Azores Islands
- Description
- This Harker Diagram shows that as the melt begins to crystallize, P2O5 crystallization increasingly occurs, but after a certain point, approximately 50% SiO2, the P2O5 percentage plummets perhaps as a result of the amount of P2O5 being exhausted. Yet at the highest stages of SiO2 percentage, P2O5 again begins to crystallize, albeit in lower percentages.

