
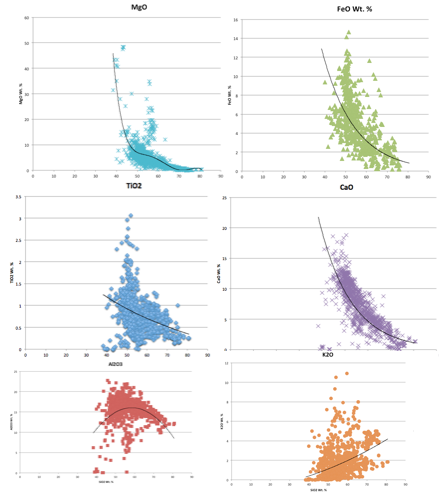
Figure 1: Harker Diagram analyzing concentrations of variable chemical components by weight percentage. SiO2 Wt. percent as the cumulative x-axis.
Media
Part of Geochemical Analysis
- Title
- Figure 1: Harker Diagram analyzing concentrations of variable chemical components by weight percentage. SiO2 Wt. percent as the cumulative x-axis.